More Granular Metrics for Better Insights


Cristina Saiu
Marketing
We have launched an update to the metrics view in the Divio Platform, giving you a clearer and more detailed look at how your applications and services are performing.
What’s new
There are two major changes in this release.
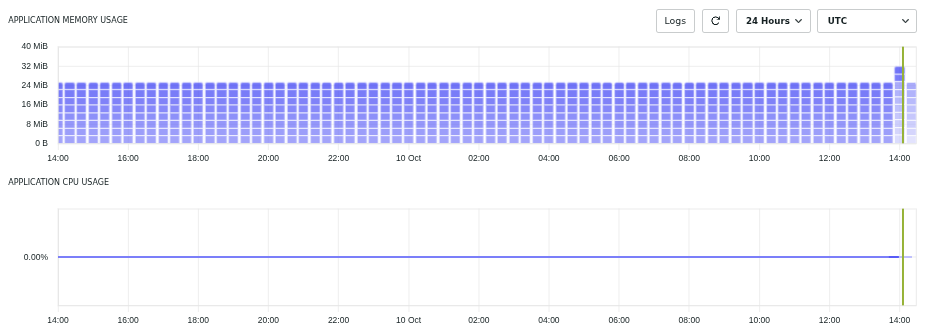
1. Instance-based metrics
Previously, Divio aggregated metrics for groups of services and displayed an average value across all instances of the same type (for example, “web”). Now, each instance is tracked and displayed separately.
In practice, this means you will see metrics per service instance instead of a single combined view. For example, if your application runs eight web instances, each one now has its own individual metrics. This provides greater visibility into how each instance performs, so you can identify resource-hungry services or spot irregular patterns faster.
For digital agencies managing multiple projects and clients, this level of detail means better insight into which client environments are driving resource usage and a clearer picture for billing, optimization, and performance tracking.
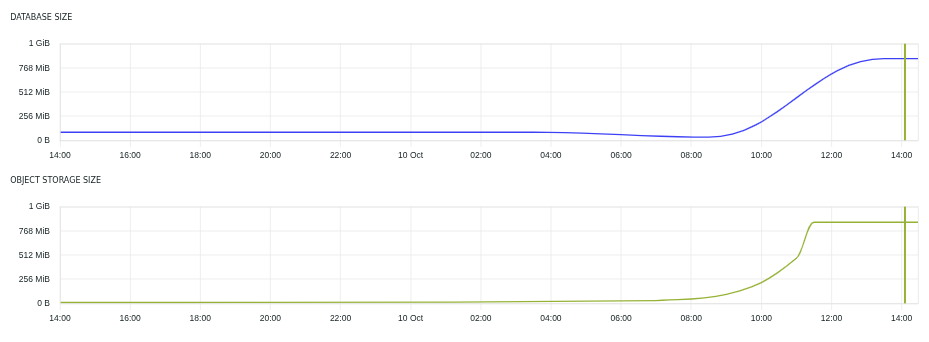
2. Database and object storage metrics
We have also added new metrics for database size and object storage usage.
Just like with service instances, these metrics are shown separately for each database or storage instance used by your application. This makes it easier to monitor growth and manage storage at a granular level.
Update frequency
Metrics are refreshed at different intervals depending on their type:
CPU and Memory: updated roughly every minute
Database and Object Storage: refreshed every few hours
These intervals reflect how frequently each metric type typically changes in real-world workloads.
Why it matters
We mainly wanted to make object and database storage usage visible so users can easily review and manage their current usage. Previously, these numbers were not readily available, making it harder to identify when a service was approaching capacity.
Now, you can monitor usage directly, which helps with optimization, forecasting, and managing growth proactively. This also allows us to alert users in advance if a service starts using more resources than expected. Users now have the visibility they need to make smart, informed decisions about their infrastructure.
For teams, especially agencies balancing multiple environments, this means fewer surprises and better control over how resources are used across projects.
Looking ahead
We are continuing to improve the metrics experience. Future updates may include increased refresh frequency for storage metrics and additional data points such as web app response times and error rates.
For now, we encourage you to explore the new metrics view and see how this added granularity helps you keep a closer eye on performance, efficiency, and scalability.
See it in action
The updated metrics view is live now for all users.
Not using Divio yet? Start your free trial today and explore the new dashboard firsthand.